Benchmarks are meant to be the gold standard. They should be repeatable, easy to understand, and ultimately be the data we use to drive decision making. Interestingly, benchmarking LLM inference systems is deceptively complex. There are many tunable settings, and different benchmarks can even contradict each other.
We want to make it easy to see how fast an inference engine is. To that end, I’m opening sourcing our benchmarking tool at Luminal. While it’s certainly not perfect ( we will continue to iterate on it over time ), hopefully it will be one of the simpler and easier to understand tools for teams to use.
These are some notes from the trenches as I tried to make sense of benchmarking LLM inference servers. I’m not claiming to have the answers — but sharing what I’ve tried and what surprised me. This blog post will go through explaining the key decisions I made when putting this together.
Our benchmarking script tracks metrics from both the client and server point of view. The general thinking is to cover the entire experience during benchmarking so there’s as little difference between the metrics we announce and the metrics a user experiences.
There are really two points of view to consider when measuring this: the server’s and the client’s.
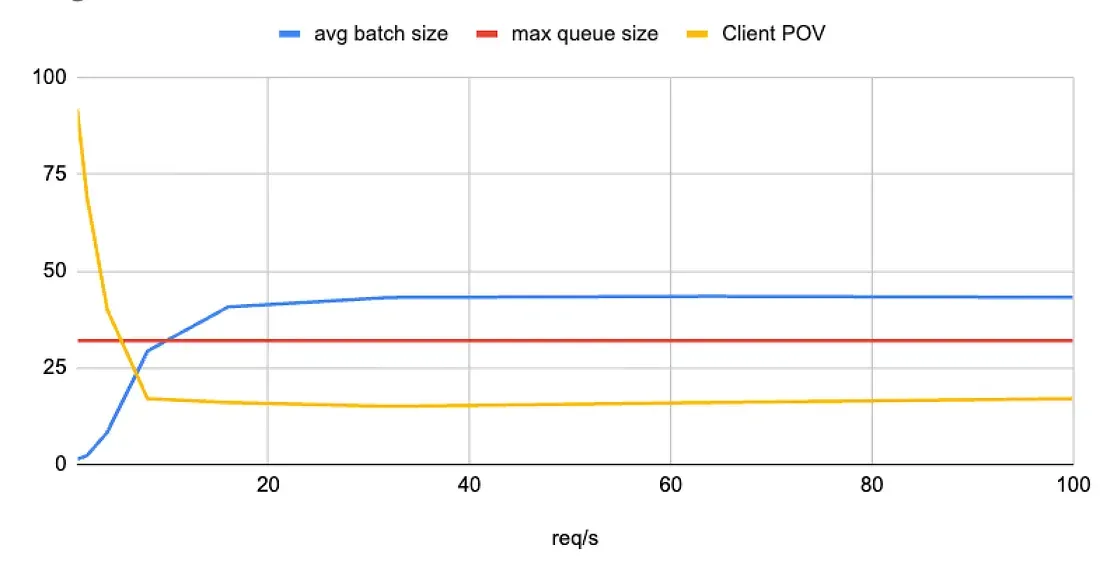
The server calculates tokens per second directly during the forward pass of the model. Modern inference engines use some form of paged attention to batch together requests, resulting in many tokens being generated simultaneously. The amount of tokens you can generate per second is called your throughput and generally your business is more cost-effective if your throughput is high. When the batch size is bigger, we have more tokens that we are processing at once, resulting in a higher throughput.
The client calculates tokens per second based on when it gets a response from the server. Consequently, this is factoring in network latencies, tokenizing time, and any pre- and post-processing that might occur on the server. For us at Luminal, this is the type of latency that matters most, as it directly impacts the customer experience.
The more time the server waits to process a bigger batch, the worse the latency is for the customer. Thus, we need to be aware of what kind of balance we’re striking between the two.
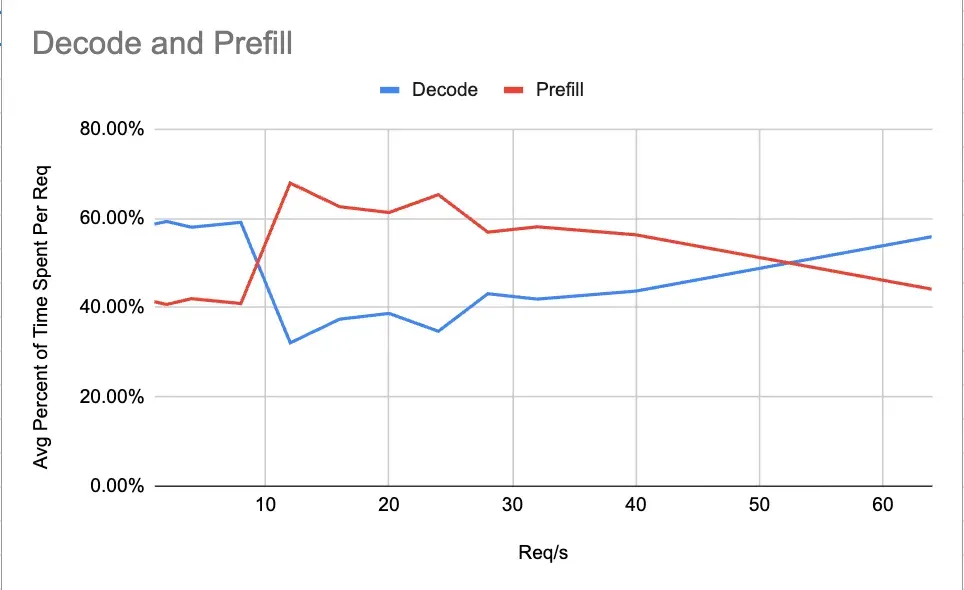
There are two distinct phases of LLM inferencing: prefill and decode. Critically, prefill is compute-bound while decode is memory-bound. Each phase benefits from different kernel optimizations. In order to see how good the prefill stage is, we use the TTFT metric, as the output of the prefill stage is the first token. On the other hand, our decode stage is best tracked via ITL.
While both of these metrics can be tracked on the server-side, I decided to track them on the client-side via enabling ‘streaming’. This measurement is again about prioritizing tracking the actual customer experience. When your customer is streaming tokens, they won’t be happy until they actually get their tokens.
Press enter or click to view image in full size

Benchmarks are only as good as they are predictive of what will really happen. To ensure our benchmarks accurately measure what a customer should expect, I did 2 things to push us closer to real-world load during benchmarking.
First, I chose to benchmark using the chat endpoint to include any overhead that a real chat request would incur (such as system/user prompt formatting, image preprocessing, etc.). This way, our numbers reflect what a user of the chat API would actually see. Some other benchmarks call the lower-level generate function to isolate model throughput; that’s useful for internal metrics but might be a bit optimistic for end-user experience measurements.
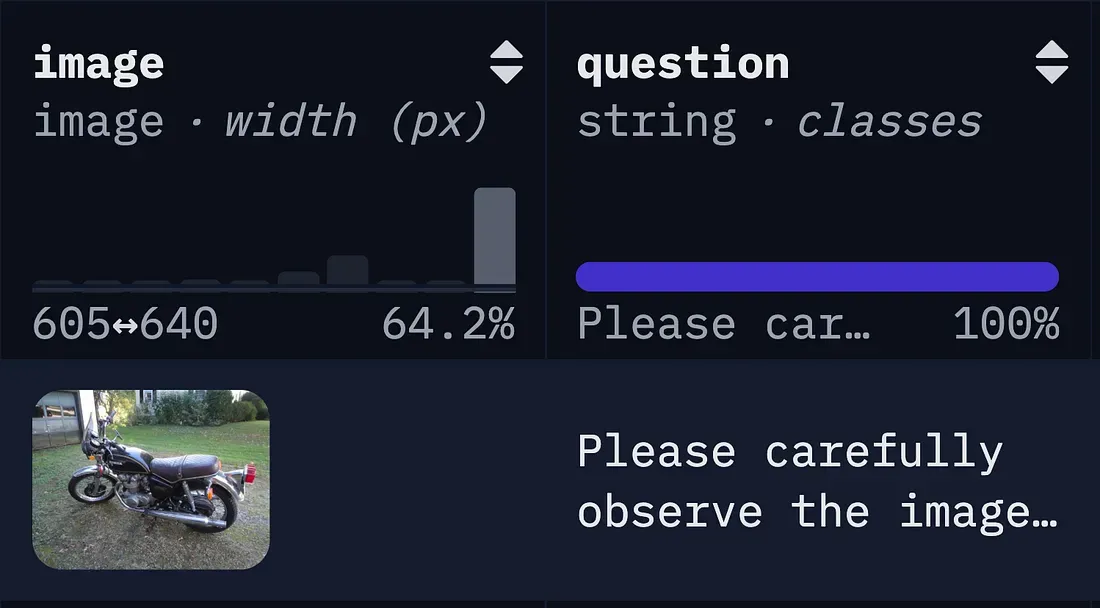
Second, I made our request data representative of the real world. For our vision language models, I used the lmms-lab/COCO-Caption2017 dataset because of its variety and quality. Then I sent the requests via a poisson distribution as requests never come uniformly in the real world.

I chose requests per second to be the key load variable. This metric lets us figure out which loads require us to start scaling and how the customer experience changes when we are being hit by many different users at once.
When benchmarking, there are certain configurations we want to hold constant throughout the run. If we do not, then our benchmarks will not give back consistent results.
Beyond benchmarking, the queue length and batch size settings are also how we ensure a minimum quality that we will serve to the user. Without this, it is practically impossible to make guarantees to the users about speed.
The batch size is the maximum number of requests our paged attention kernel can handle at once. The larger this value is, the higher your potential throughput can be. Generally you set this as high as you can for your resources.
A consequence of doing batched requests is the necessity of queue, and that queue quickly becomes a major source of latency. Any requests that come in while the current batch is being processed have to wait for it to finish. This introduces the largest latency as any request at the back of the line is going to have a significantly higher latency than any other request based solely off its place in line.
The biggest lesson was how strongly queue saturation affects benchmark consistency. When the queue fills, latency naturally rises. If you run the same test with a different number of requests and don’t account for this, your results will vary.
To avoid this, keep your maximum queue length consistent and measure how long requests wait there. This way of testing also lets you put a floor on what the worst possible experience looks like.

Ahmed
October 15, 2025
Ahmed Tried cooding
hh
October 14, 2025
grg